Pretrial Demographics
Active Pretrial Participants - Gender
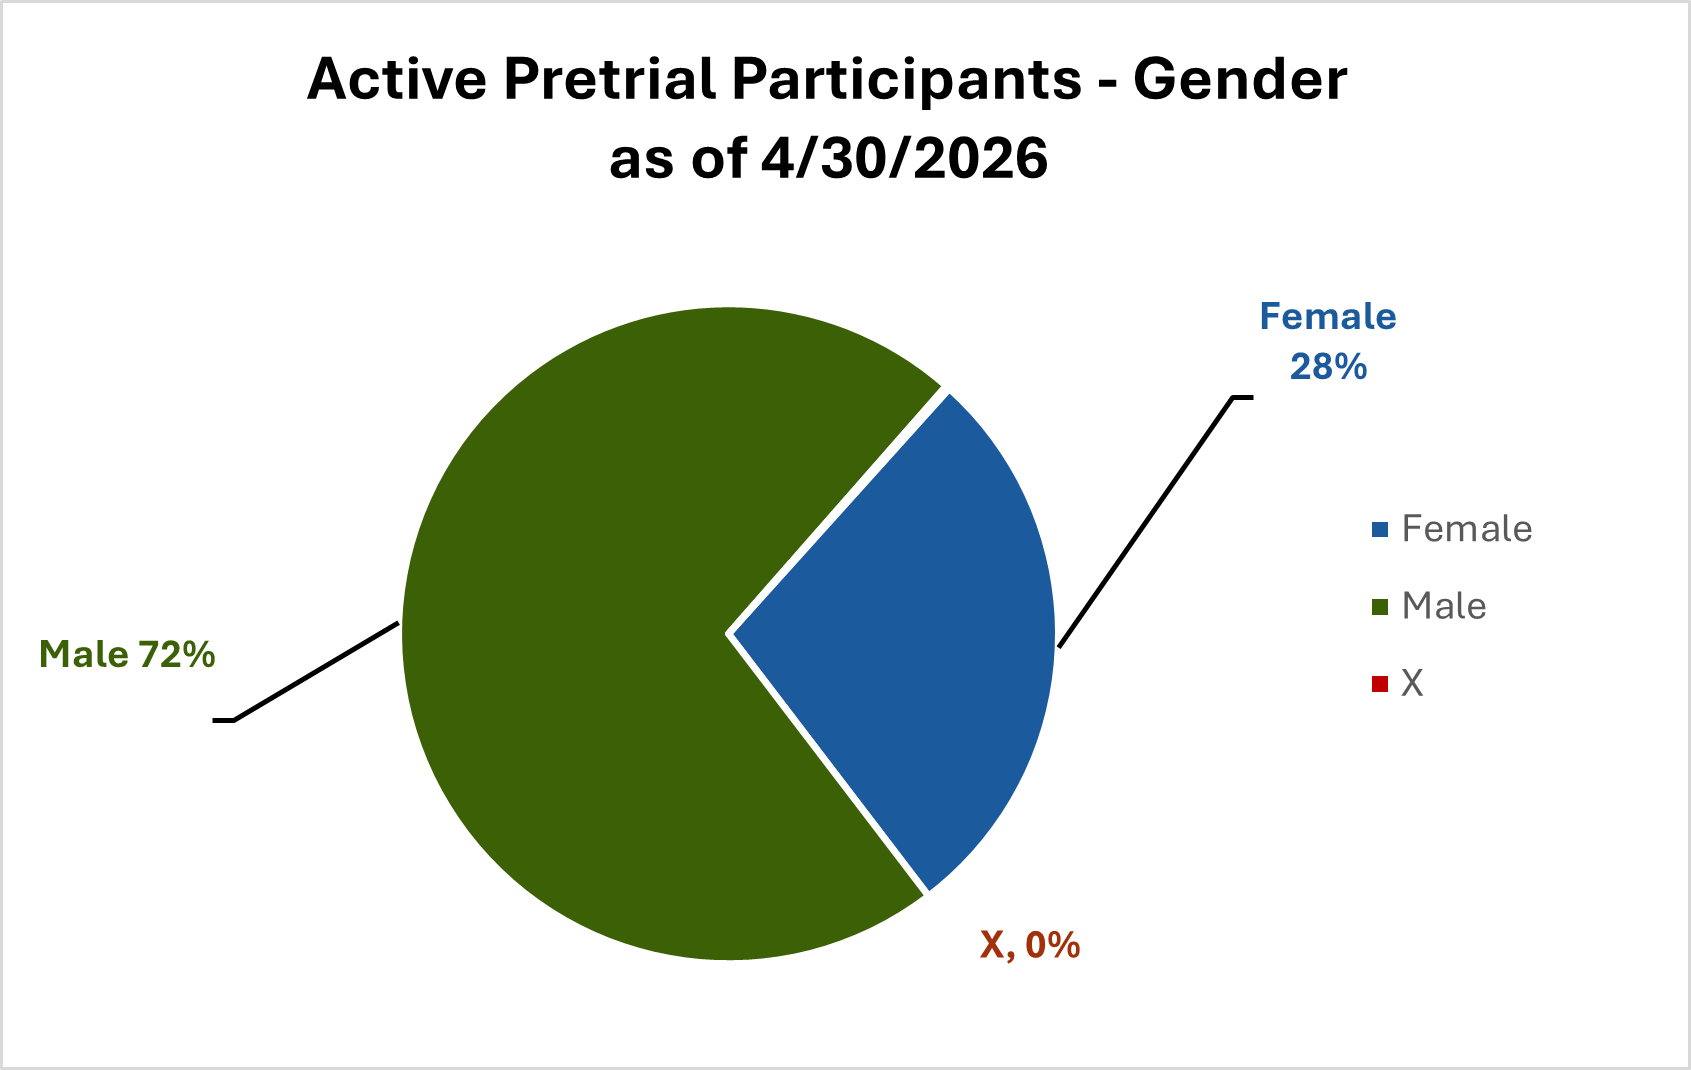
Chart Data
- Male: 74% (1752)
- Female: 25% (600)
- X: 0% (5)
All Pretrial Participants - Gender
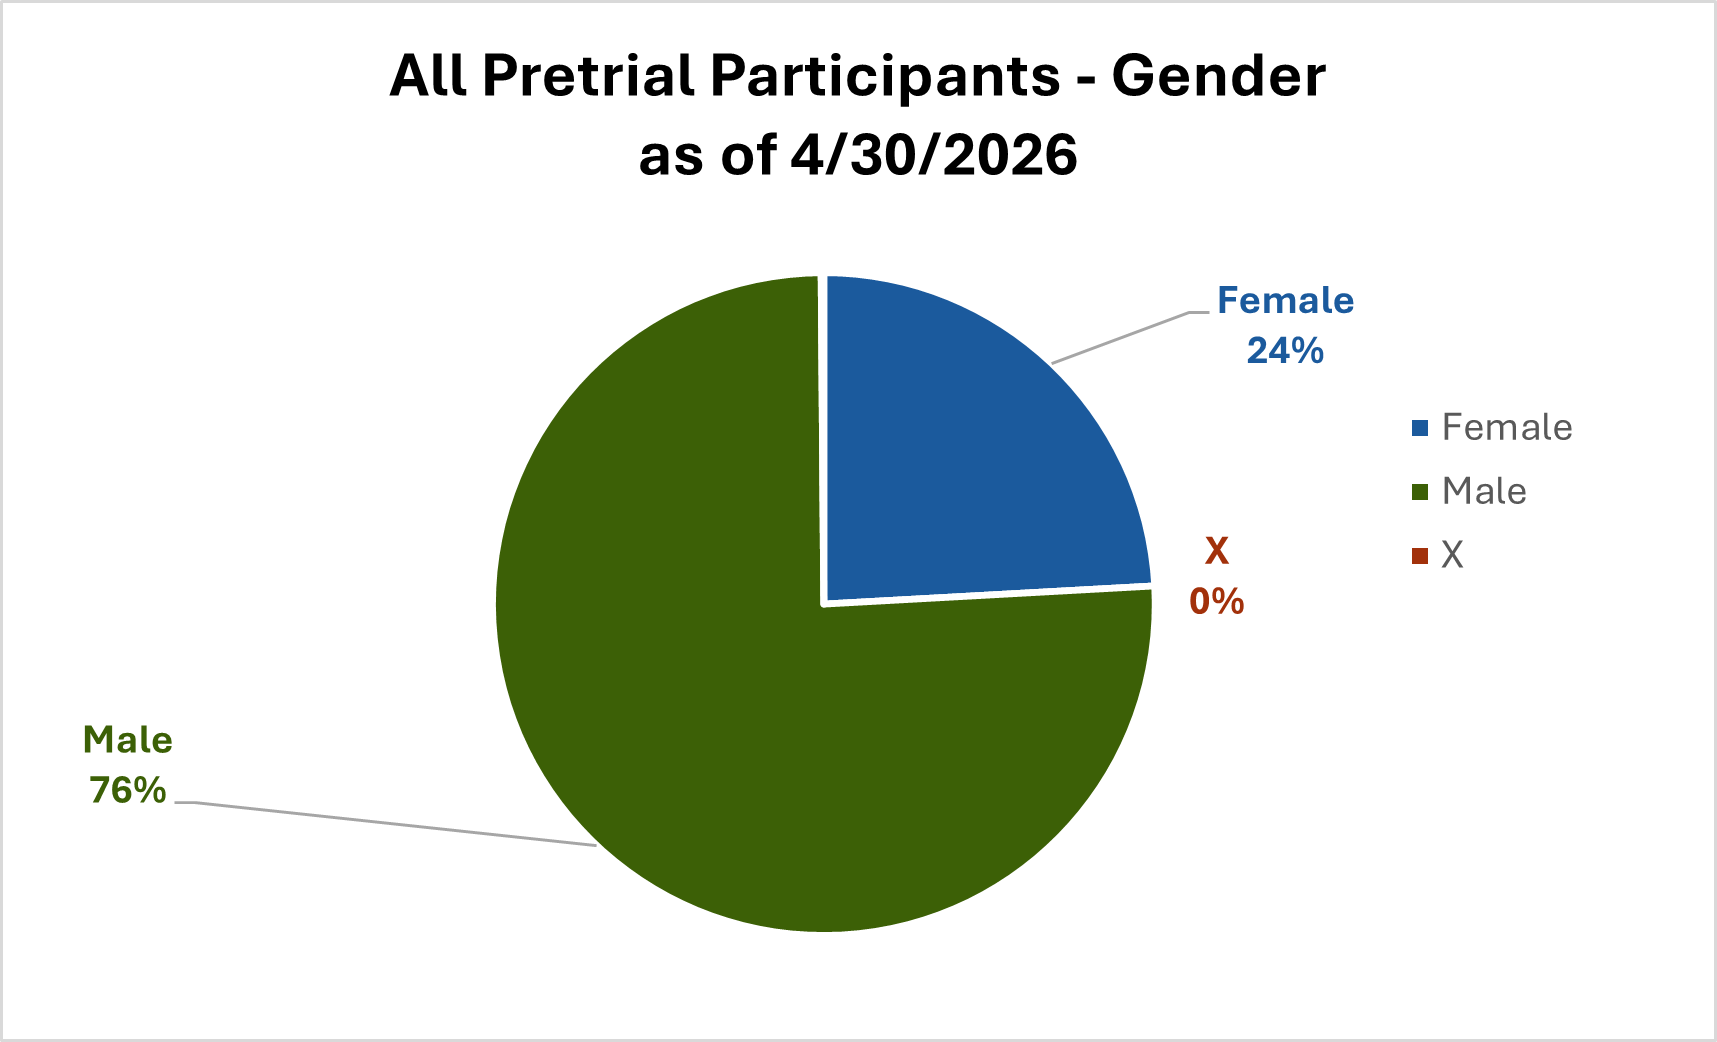
Chart Data
- Male: 76% (13380)
- Female: 24% (4179)
- X: 0% (23)
Active Pretrial Participants - Ethnicity
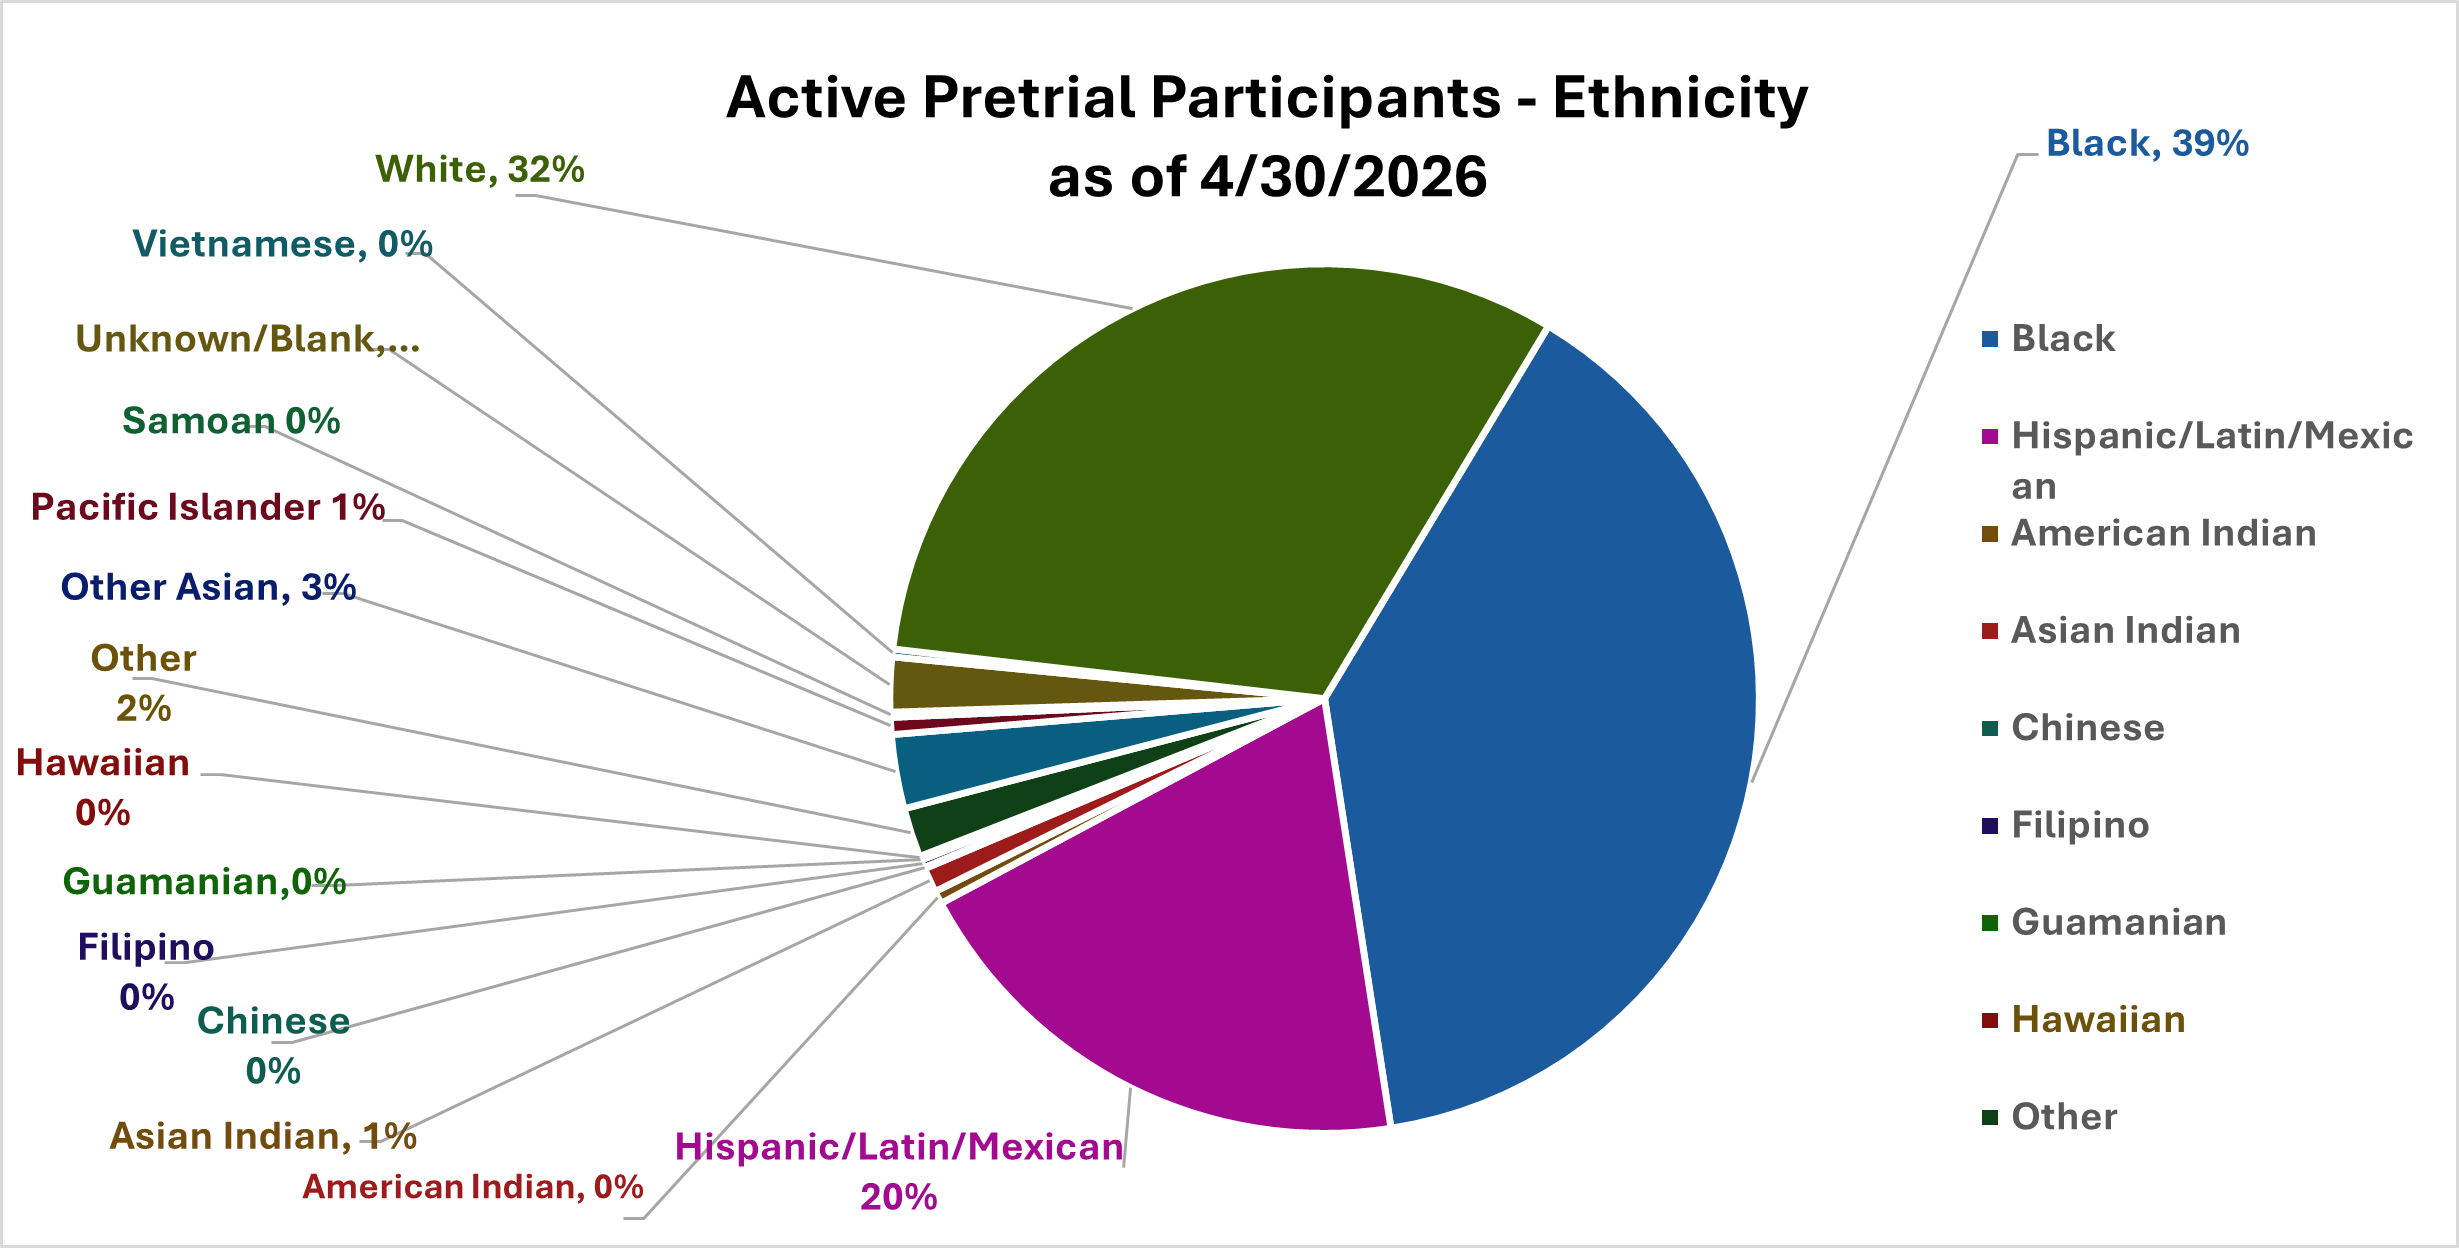
Chart Data
- Black: 38% (895)
- Hispanic/Latin/Mexican: 21% (491)
- American Indian: 0% (10)
- Asian Indian: 0% (23)
- Chinese: 0% (1)
- Filipino: 0% (8)
- Other: 1% (48)
- Other Asian: 1% (72)
- Pacific Islander: 0% (16)
- Samoan: 0% (1)
- Unknown/Blank: 0% (40)
- Vietnamese: 0% (5)
- White: 32% (754)
All Pretrial Participants - Ethnicity
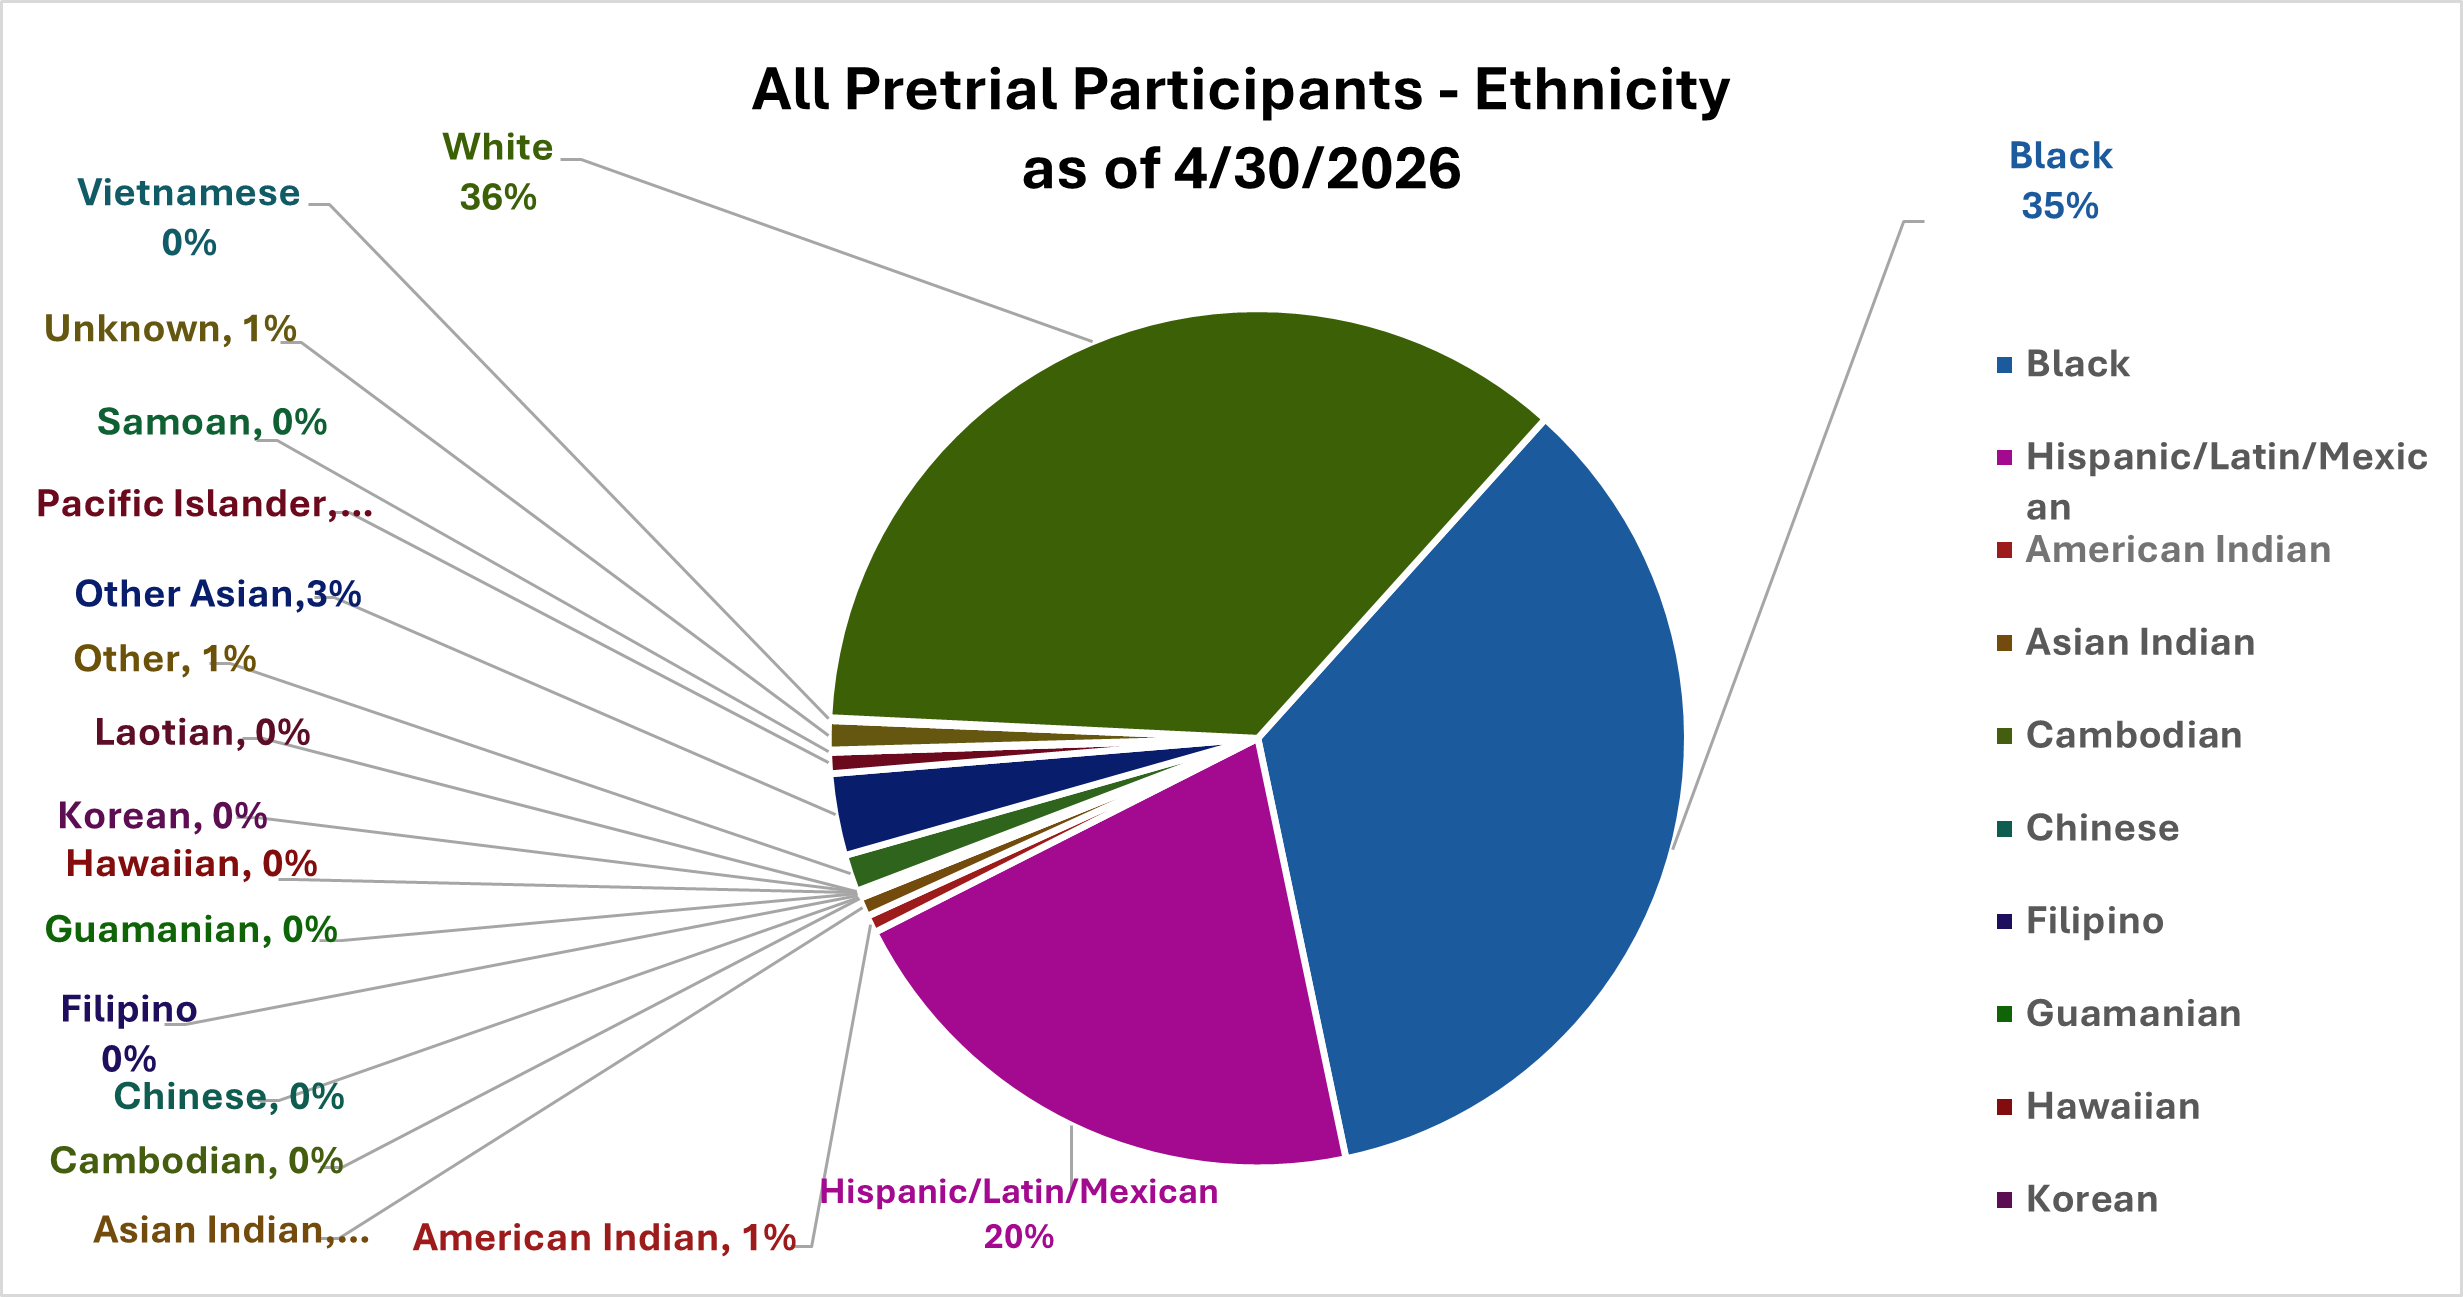
Chart Data
- Black: 35% (6148)
- Hispanic/Latin/Mexican: 21% (3706)
- American Indian: 0% (119)
- Asian Indian: 0% (130)
- Cambodian: 0% (2)
- Chinese: 0% (5)
- Filipino: 0% (28)
- Guamanian: 0% (2)
- Hawaiian: 0% (10)
- Korean: 0% (1)
- Laotian: 0% (2)
- Other: 1% (261)
- Other Asian: 3% (545)
- Pacific Islander: 1% (140)
- Samoan: 0% (12)
- Unknown/Blank: 1% (187)
- Vietnamese: 0% (18)
- White: 36% (6267)
Active Pretrial Participants - Age
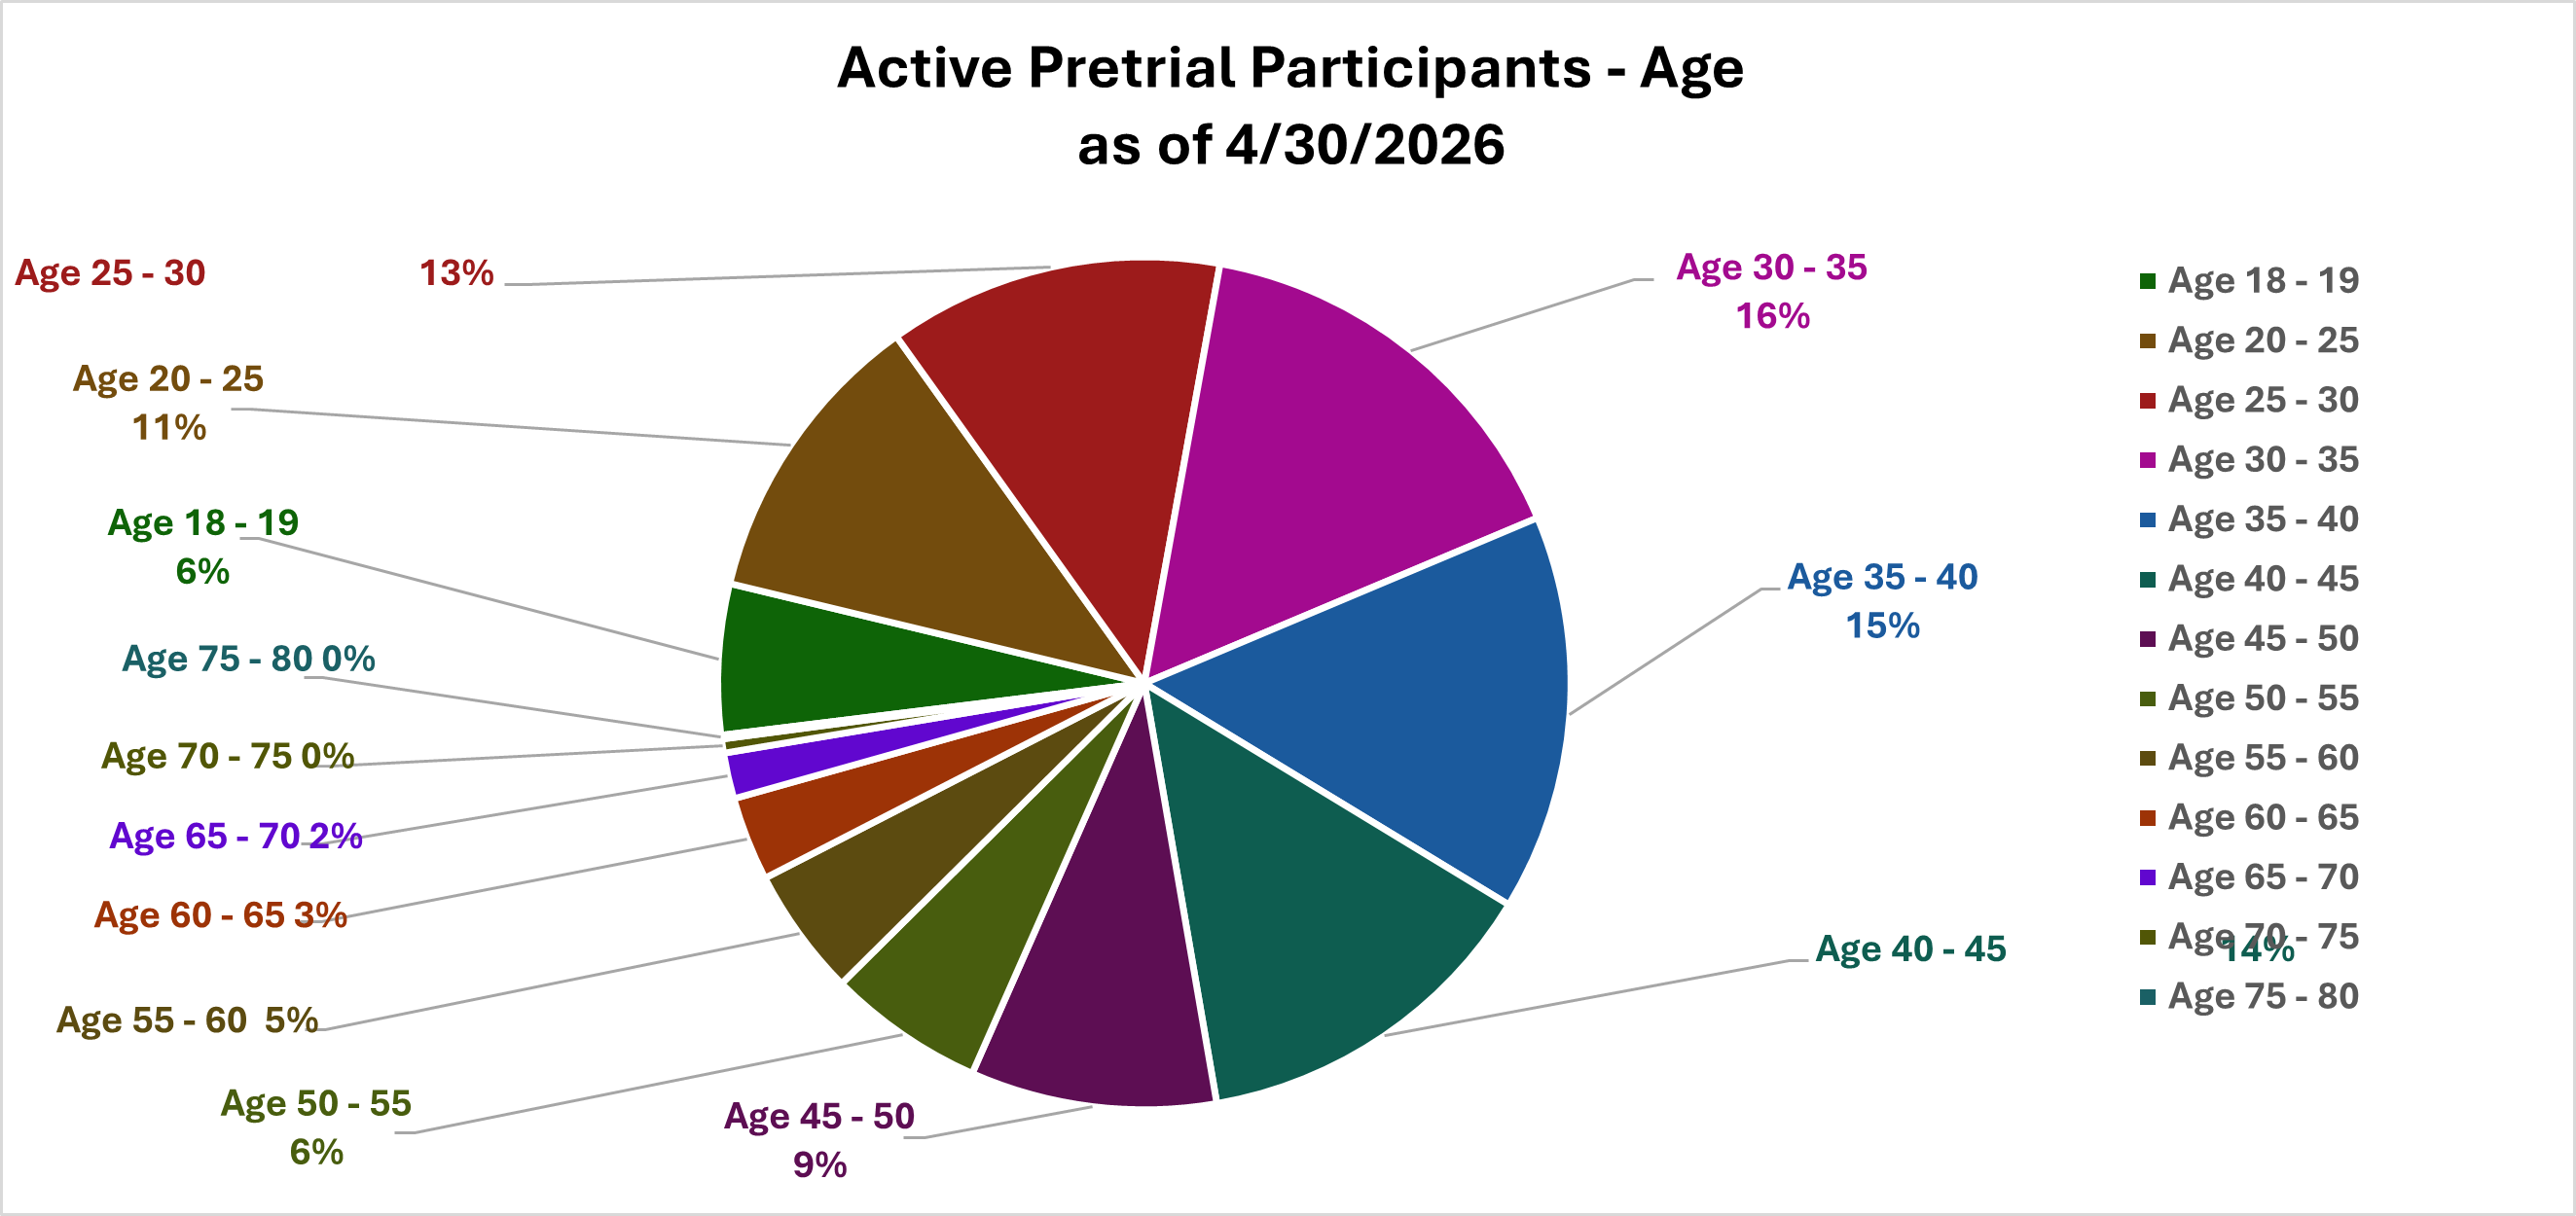
Chart Data
- Age 18 to 19: 6% (132)
- Age 20 to 25: 11% (264)
- Age 25 to 30: 13% (293)
- Age 30 to 35: 16% (371)
- Age 35 to 40: 16% (372)
- Age 40 to 45: 14% (319)
- Age 45 to 50: 9% (213)
- Age 50 to 55: 6% (142)
- Age 55 to 60: 5% (123)
- Age 60 to 65: 3% (70)
- Age 65 to 70: 2% (42)
- Age 70 to 75: 1% (14)
- Age 75 to 80: 0% (5)
All Pretrial Participants - Age
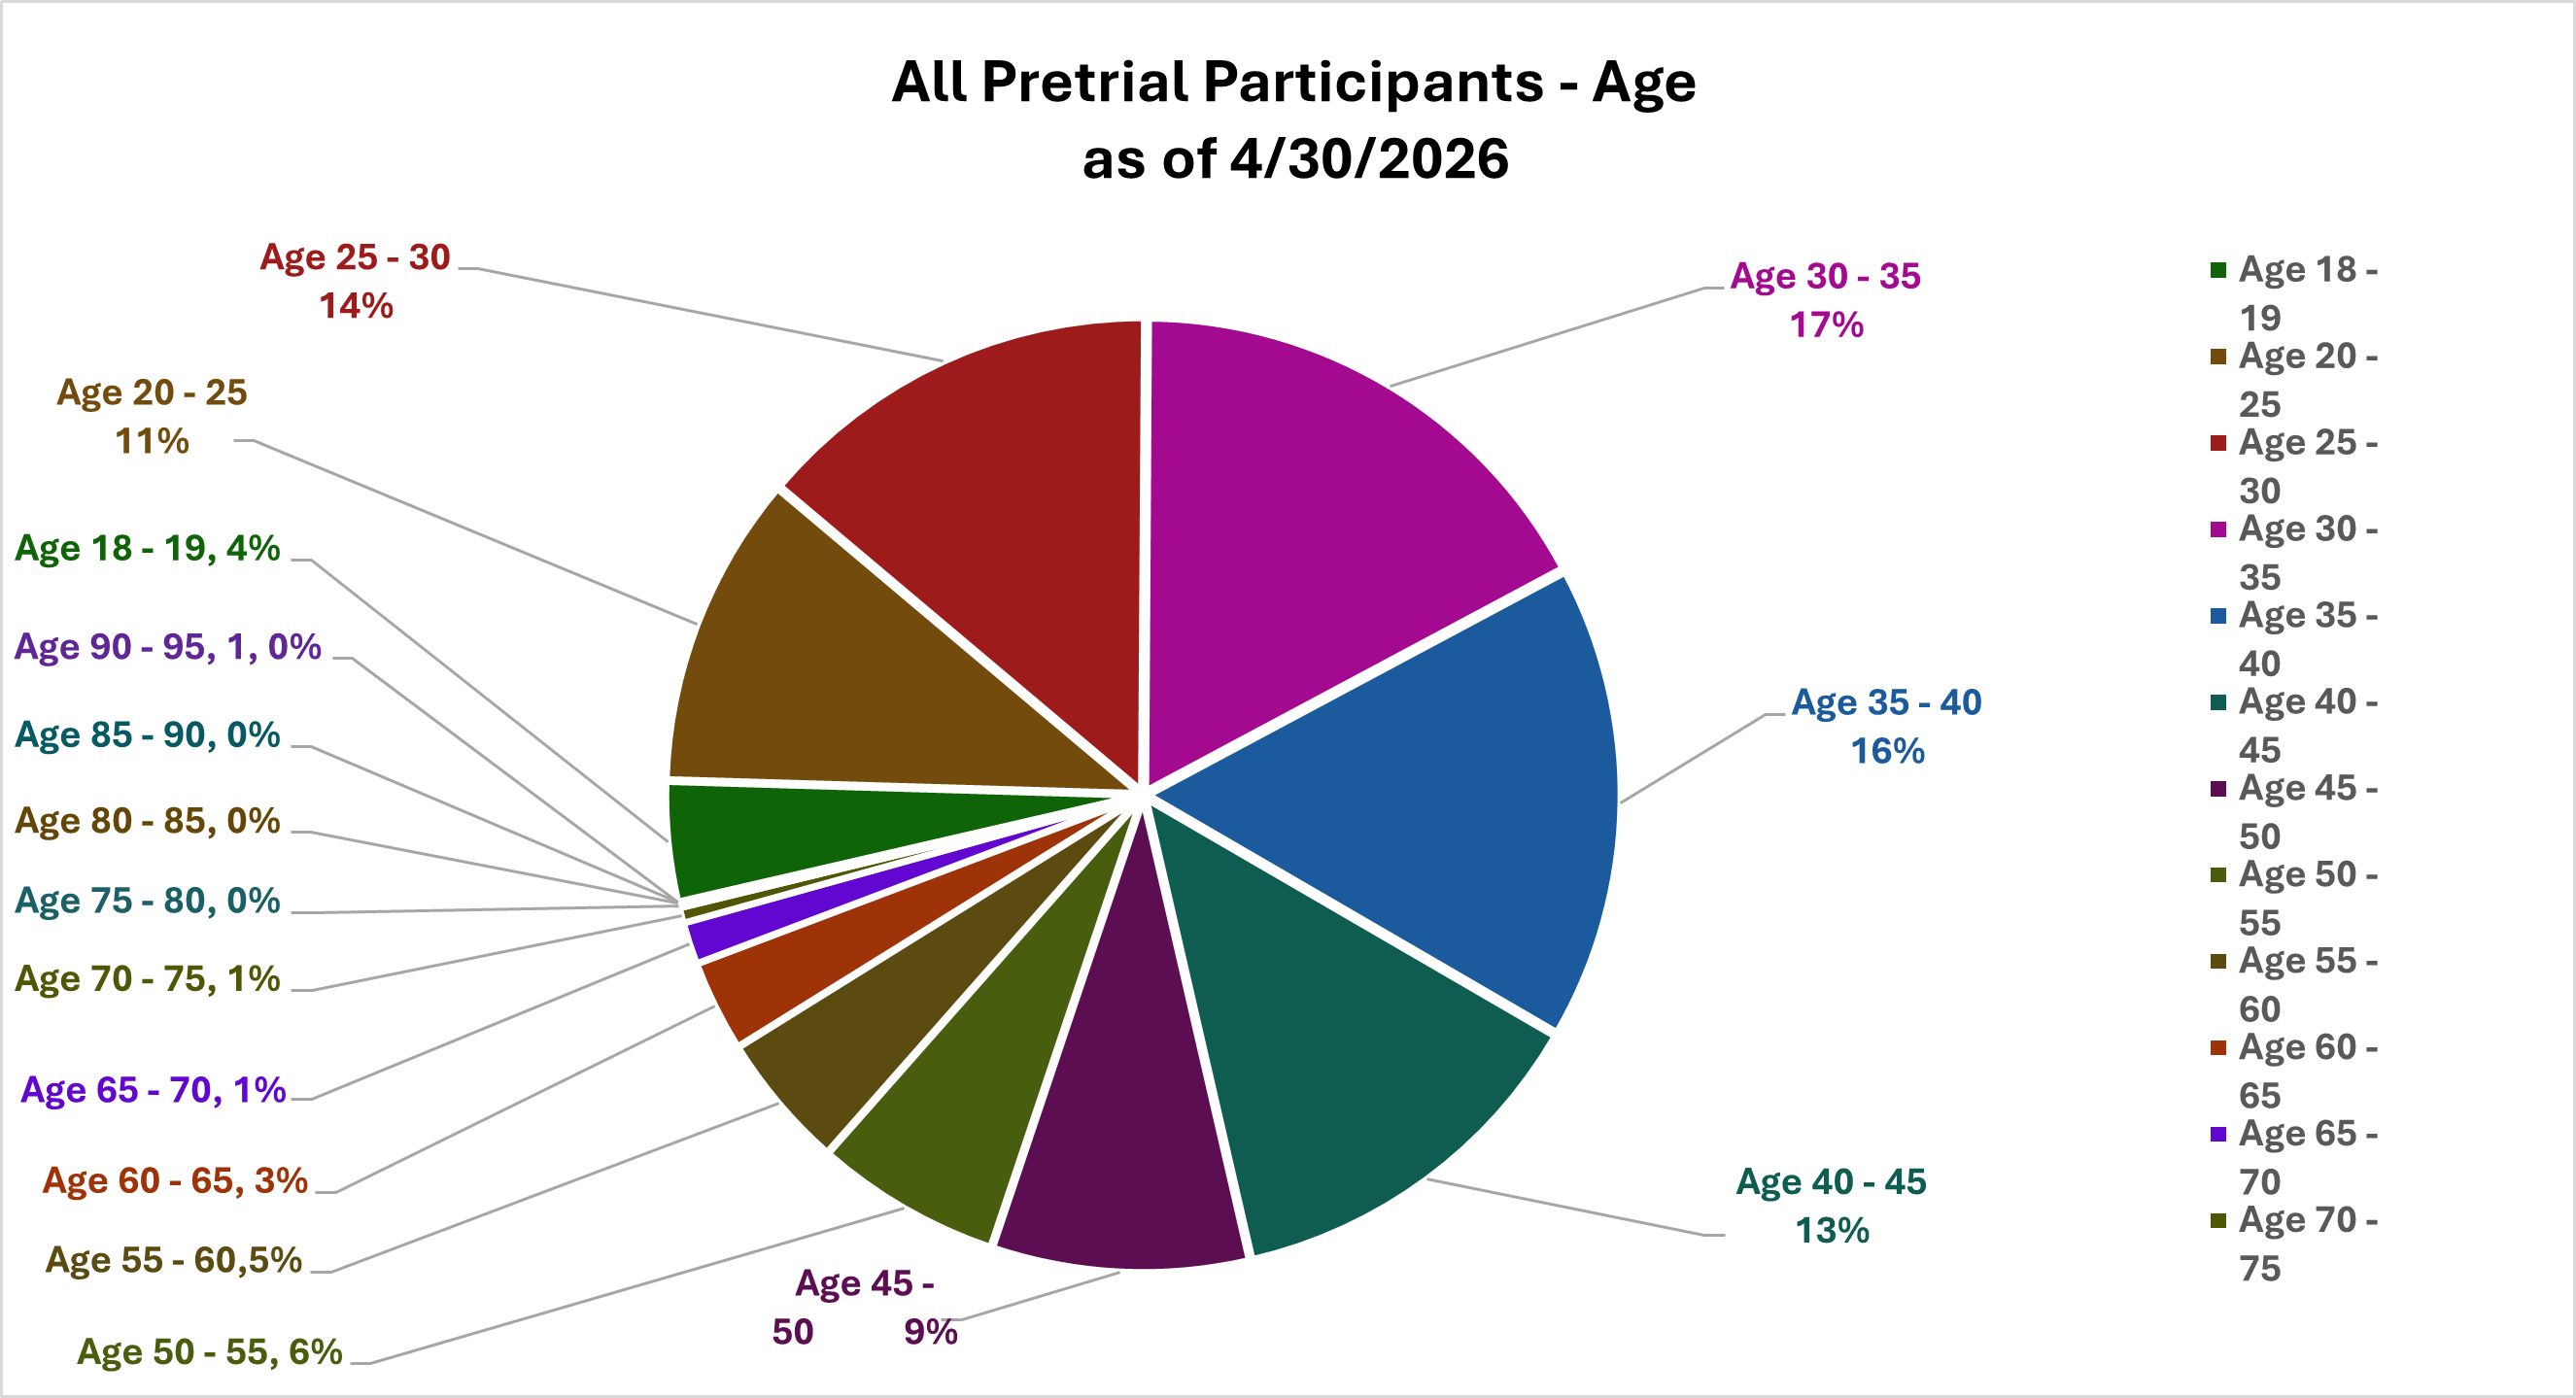
Chart Data
- Age 18 to 19: 5% (762)
- Age 20 to 25: 11% (1942)
- Age 25 to 30: 15% (2548)
- Age 30 to 35: 18% (3138)
- Age 35 to 40: 17% (3001)
- Age 40 to 45: 14% (2423)
- Age 45 to 50: 9% (1613)
- Age 50 to 55: 7% (1175)
- Age 55 to 60: 5% (883)
- Age 60 to 65: 3% (573)
- Age 65 to 70: 2% (271)
- Age 70 to 75: 1% (104)
- Age 75 to 80: 0% (31)
- Age 80 to 85: 0% (4)
- Age 85 to 90: 0% (2)
- Age 90 to 95: 0% (1)