Pretrial Demographics
Active Pretrial Participants - Gender (as of 3/31/2026)
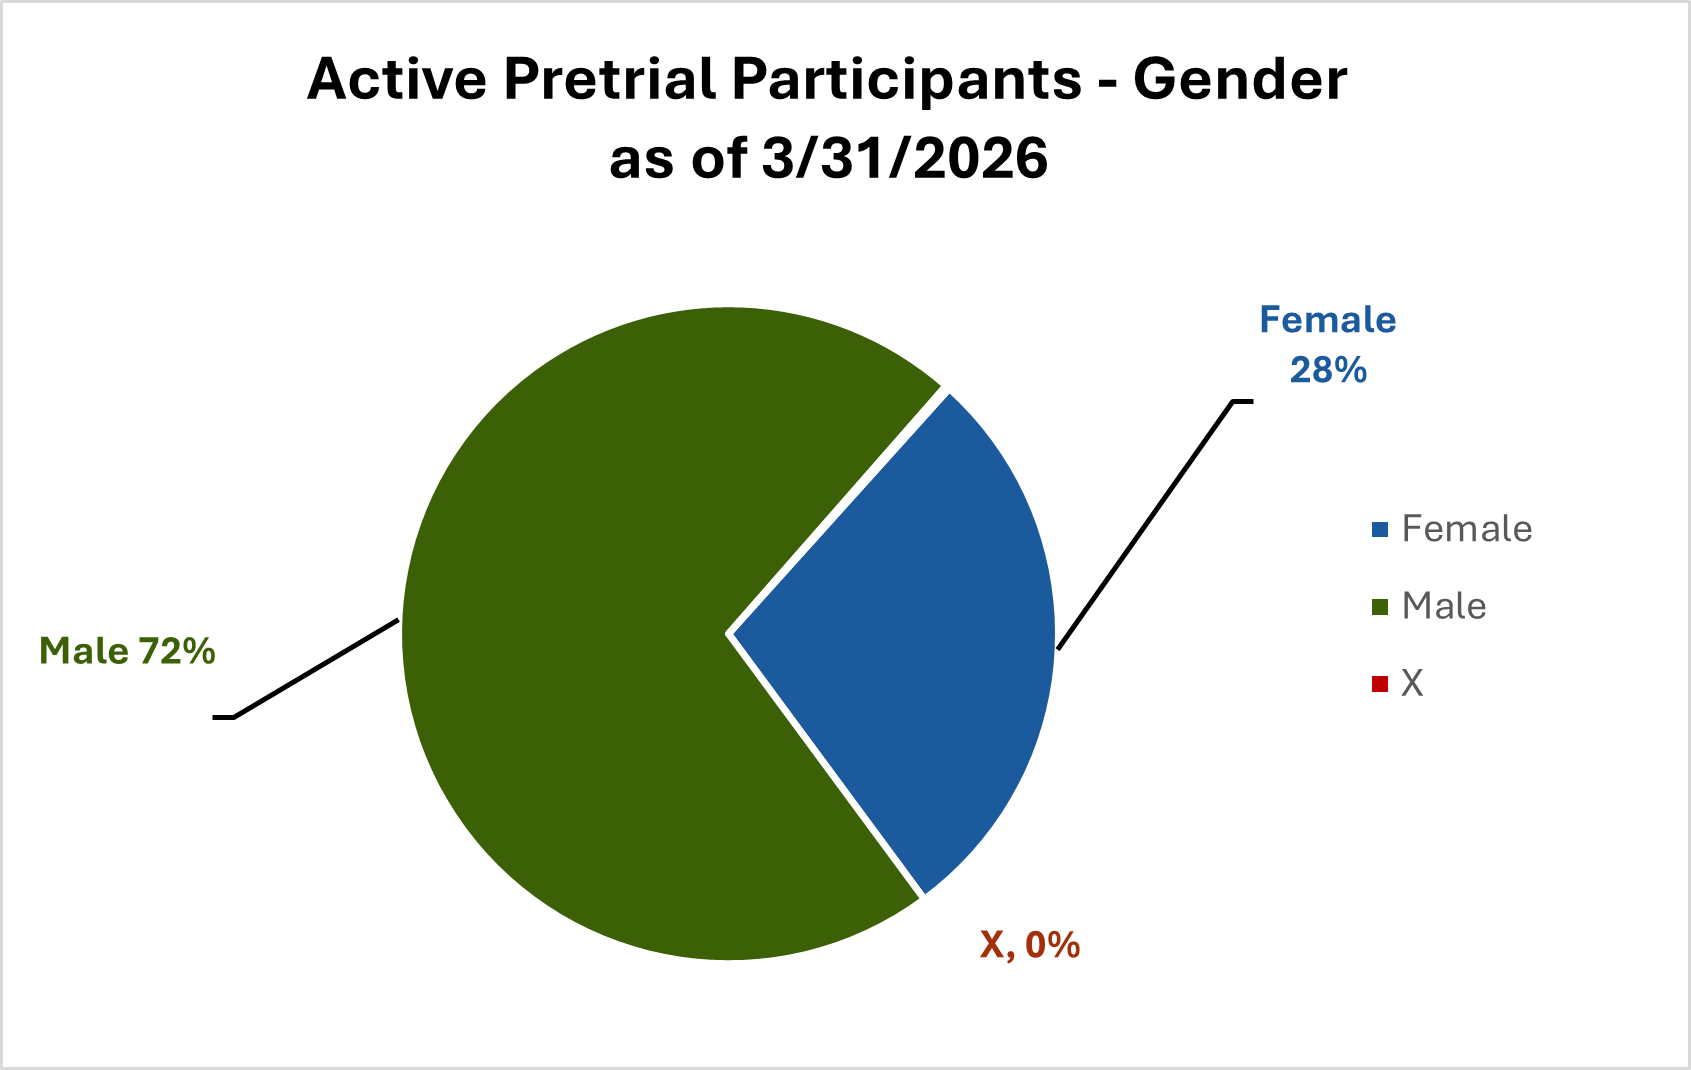
Chart Data
- Male: 72% (1395)
- Female: 28% (550)
- X: 0% (4)
All Pretrial Participants - Gender (as of 3/31/2026)
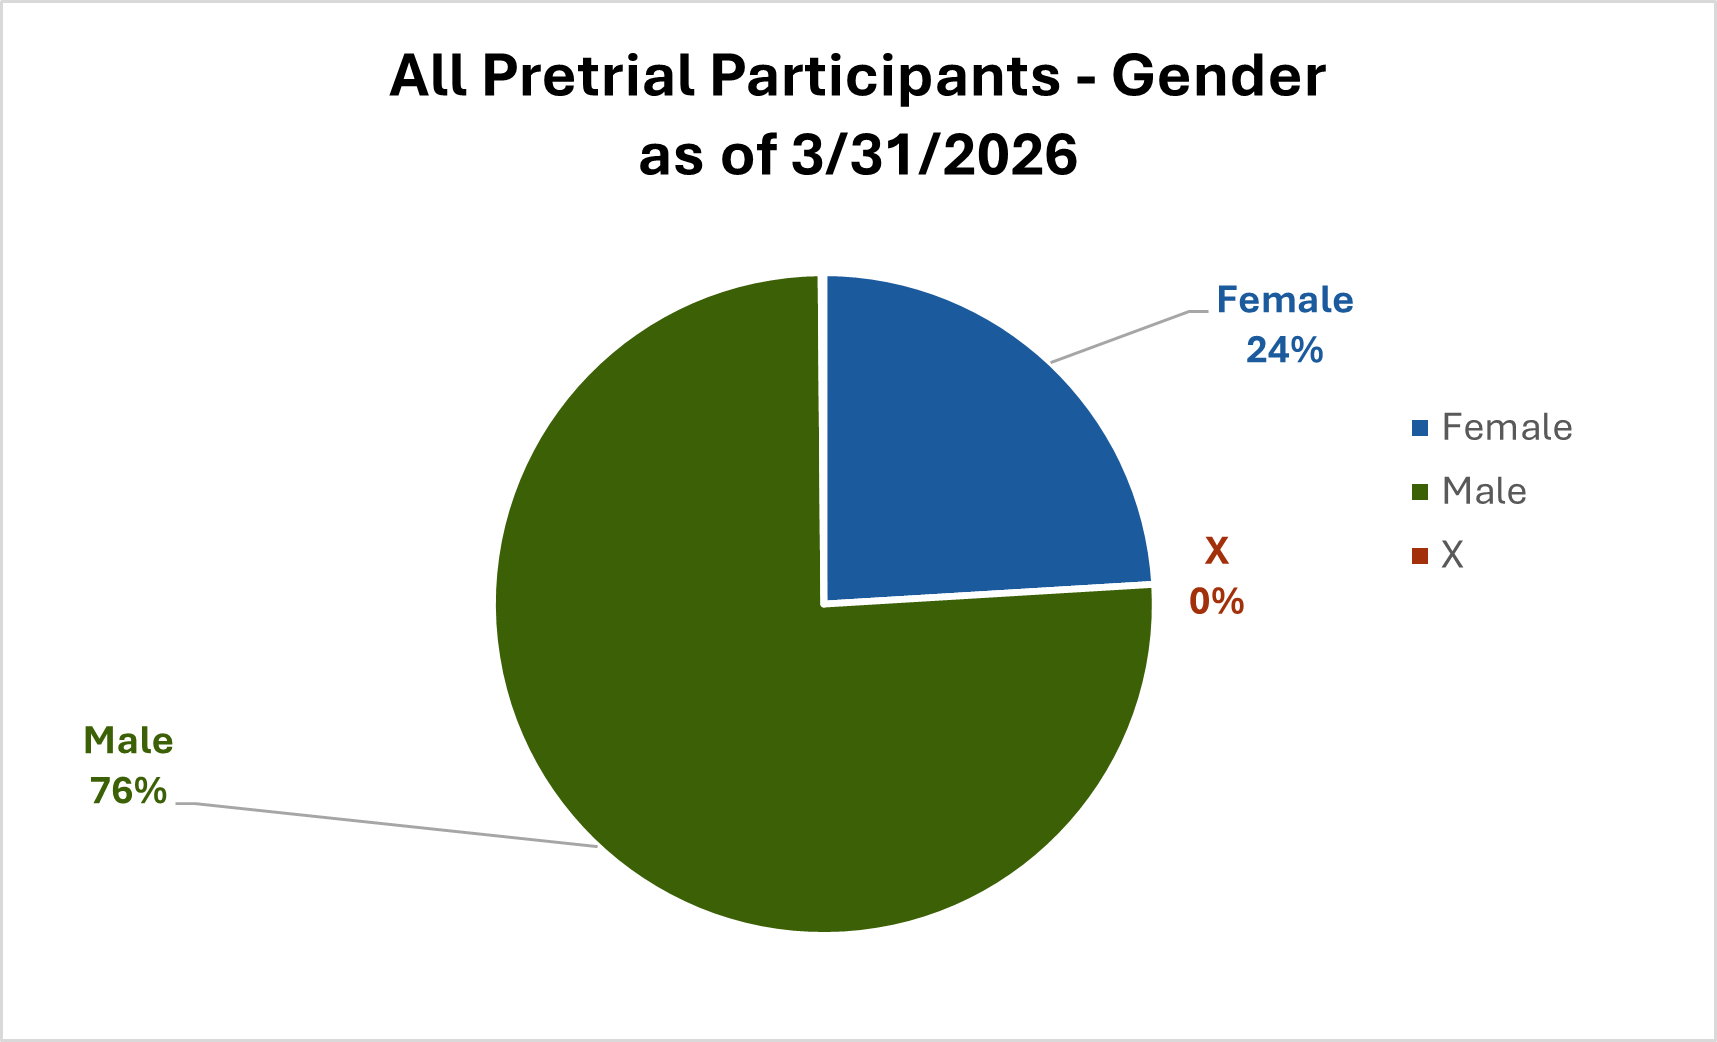
Chart Data
- Male: 76% (12136)
- Female: 24% (3849)
- X: 0% (21)
Active Pretrial Participants - Ethnicity (as of 3/31/2026)
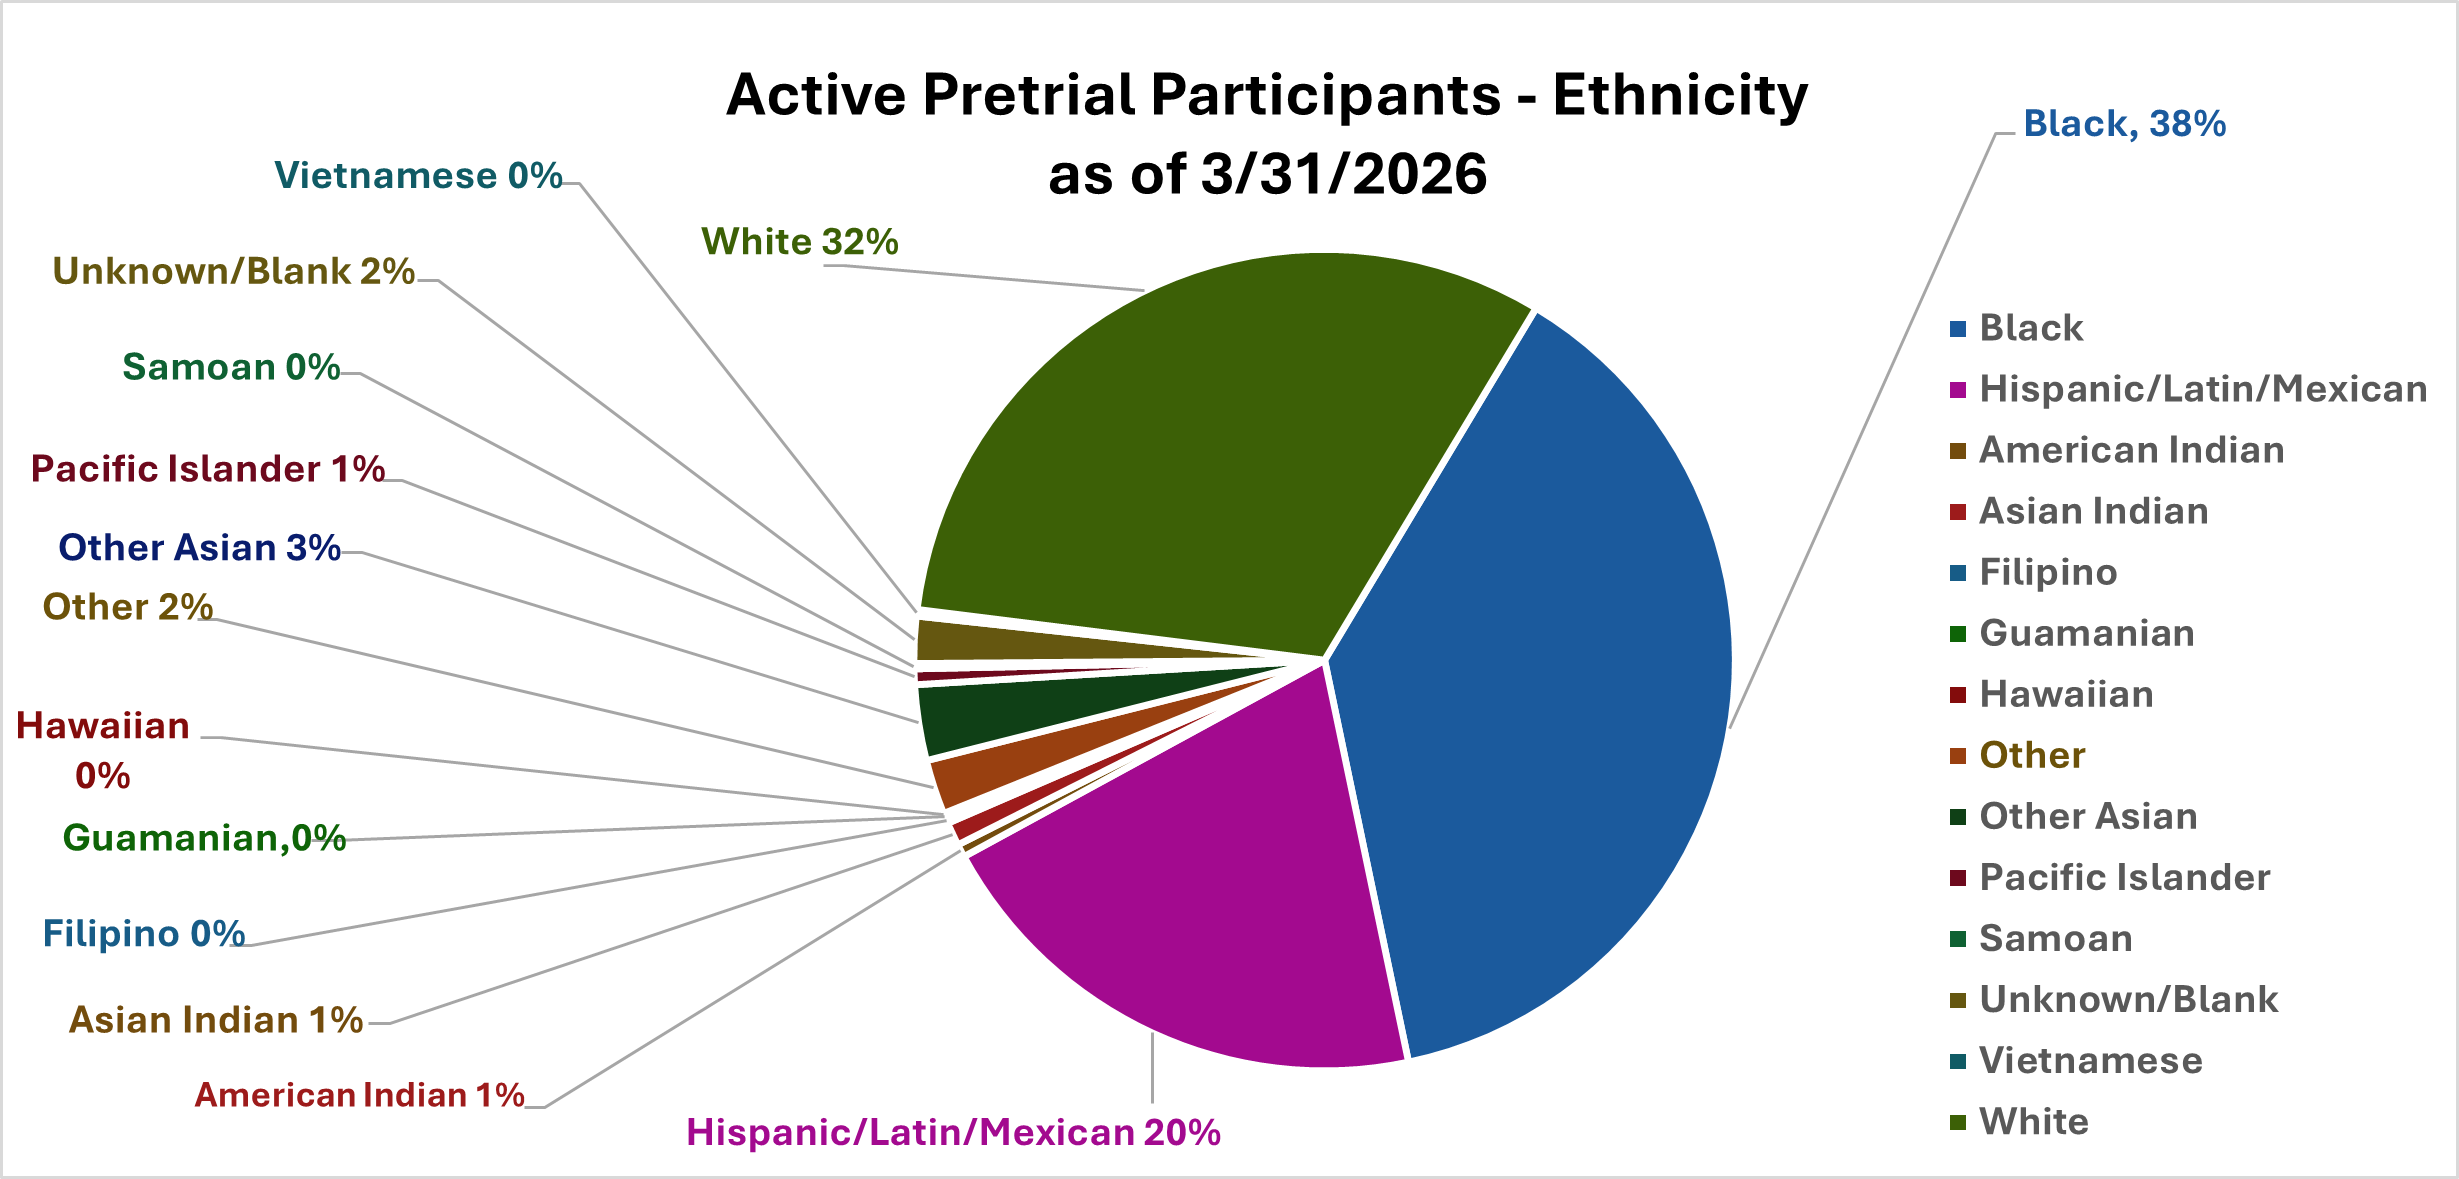
Chart Data
- Black: 38% (742)
- Hispanic/Latin/Mexican: 20% (396)
- American Indian: 1% (10)
- Asian Indian: 1% (18)
- Filipino: 1% (5)
- Guamanian 0% (1)
- Other: 2% (42)
- Other Asian: 3% (58)
- Pacific Islander: 1% (12)
- Samoan: 0% (4)
- Unknown/Blank: 2% (36)
- Vietnamese: 0% (5)
- White: 33% (616)
All Pretrial Participants - Ethnicity (as of 3/31/2026)
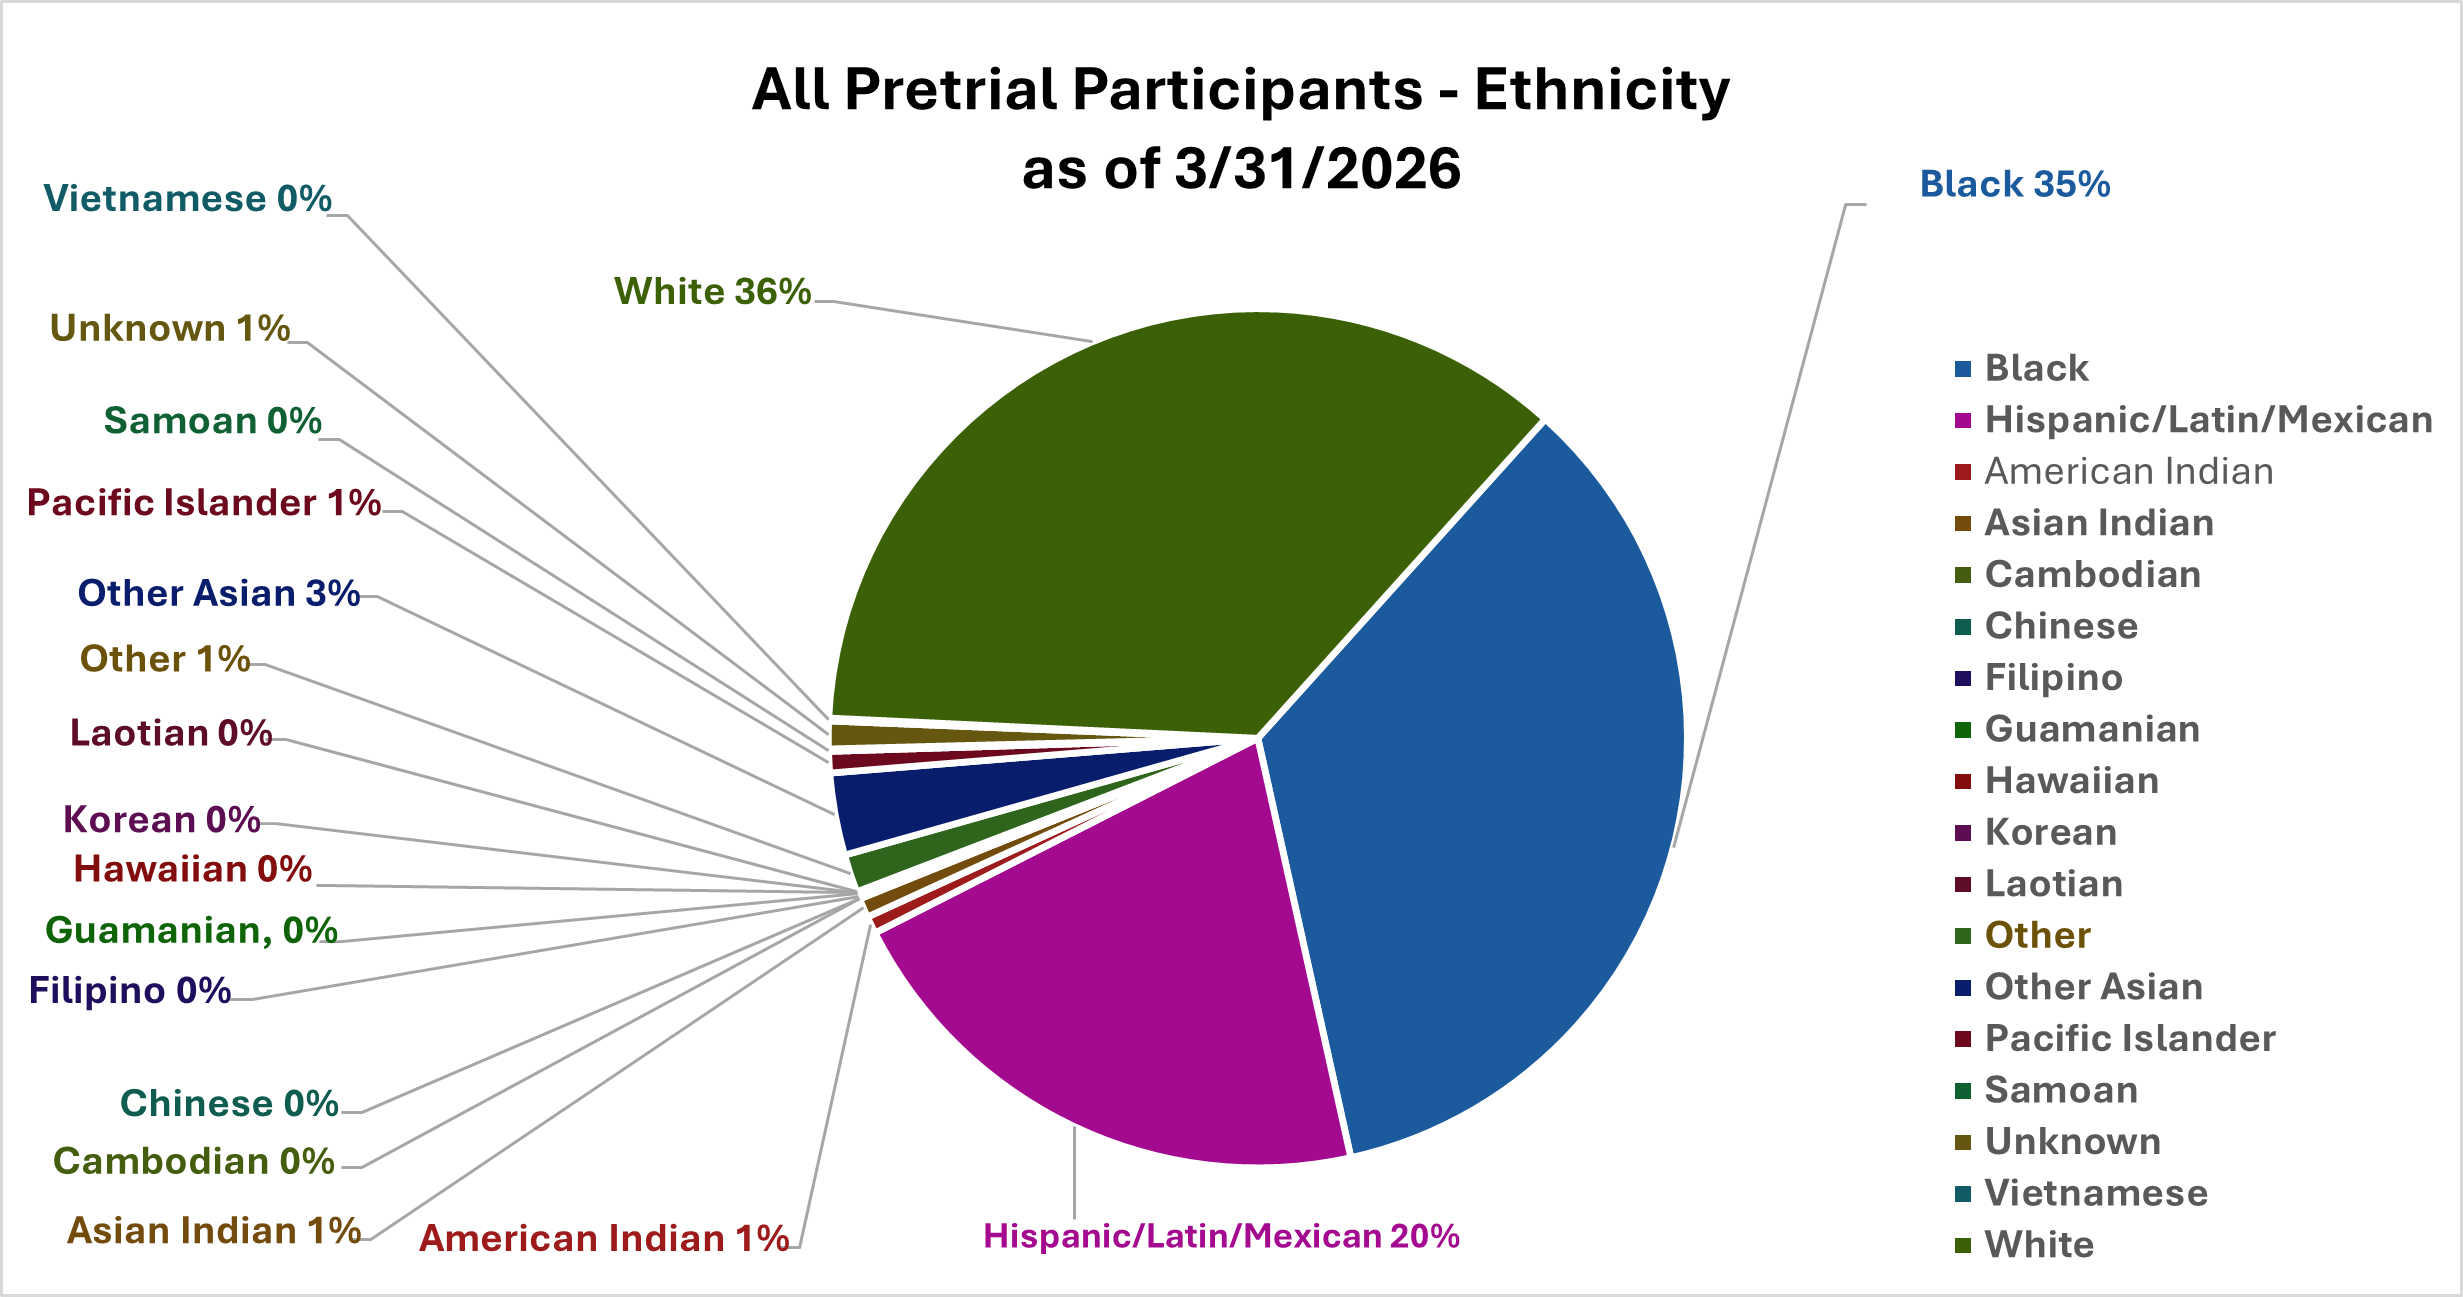
Chart Data
- Black: 35% (5580)
- Hispanic/Latin/Mexican: 21% (3359)
- American Indian: 1% (105)
- Asian Indian: 1% (117)
- Cambodian: 0% (2)
- Chinese: 0% (3)
- Filipino: 0% (25)
- Guamanian: 0% (3)
- Hawaiian: 0% (9)
- Korean: 0% (1)
- Laotian: 0% (2)
- Other: 1% (230)
- Other Asian: 3% (495)
- Pacific Islander: 1% (129)
- Samoan: 0% (14)
- Unknown/Blank: 1% (167)
- Vietnamese: 0% (17)
- White: 36% (5749)
Active Pretrial Participants - Age (as of 3/31/2026)
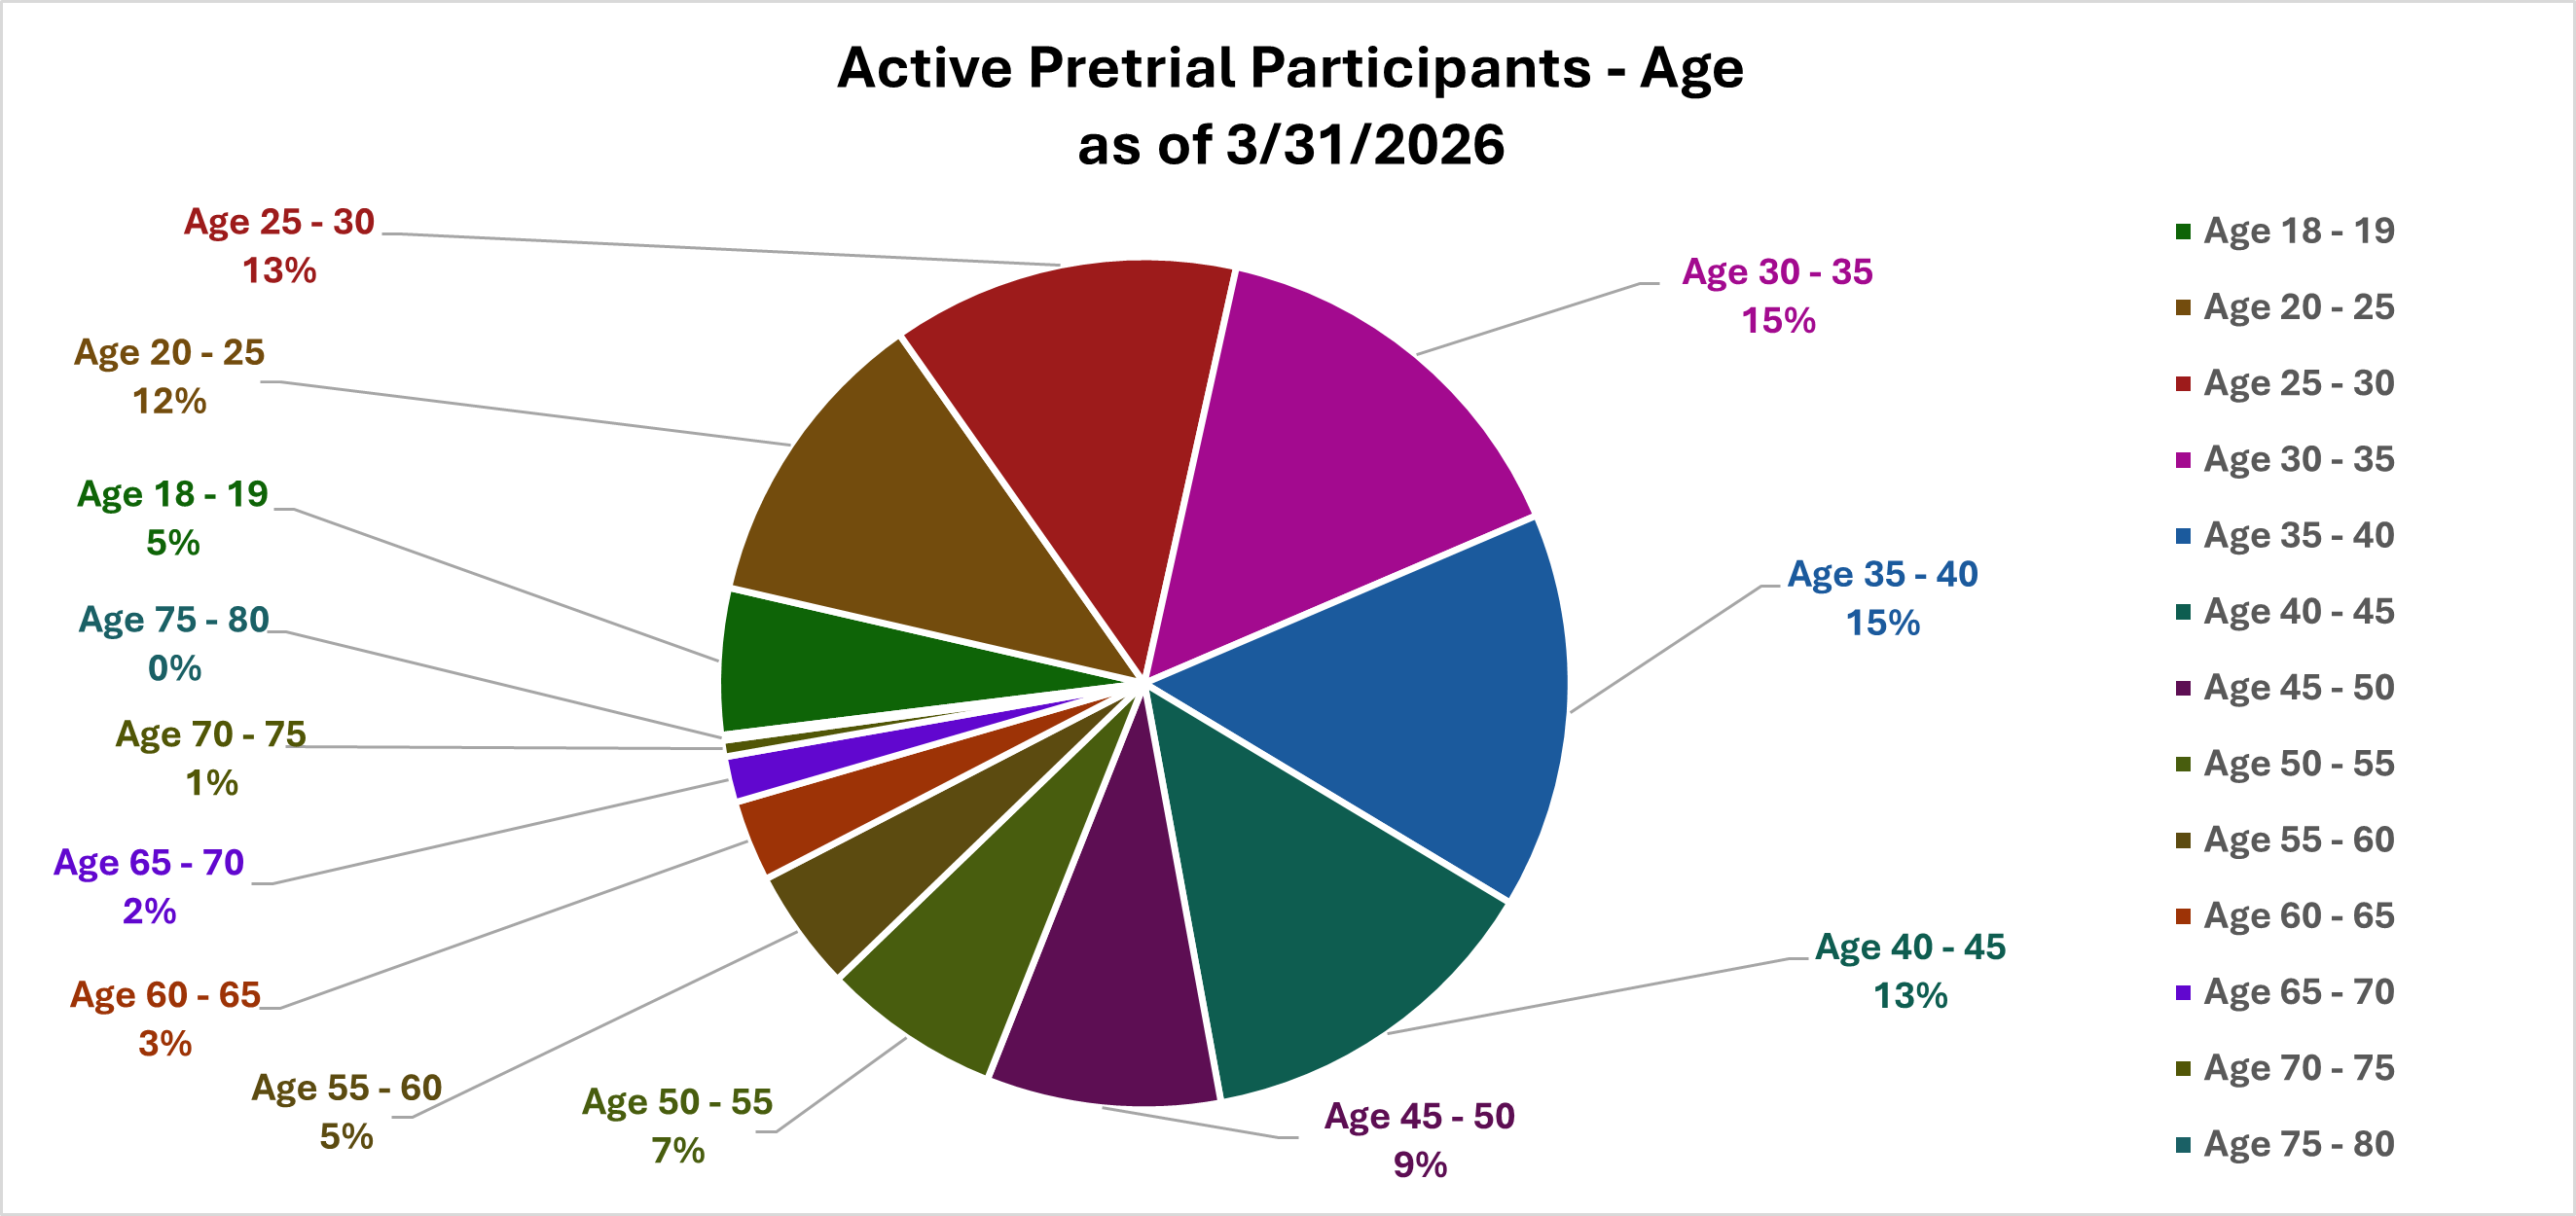
Chart Data
- Age 18 to 19: 5% (108)
- Age 20 to 25: 12% (27)
- Age 25 to 30: 13% (257)
- Age 30 to 35: 15% (294)
- Age 35 to 40: 15% (293)
- Age 40 to 45: 14% (263)
- Age 45 to 50: 9% (173)
- Age 50 to 55: 7% (132)
- Age 55 to 60: 5% (90)
- Age 60 to 65: 3% (60)
- Age 65 to 70: 2% (34)
- Age 70 to 75: 1% (12)
- Age 75 to 80: 0% (4)
All Pretrial Participants - Age (as of 3/31/2026)
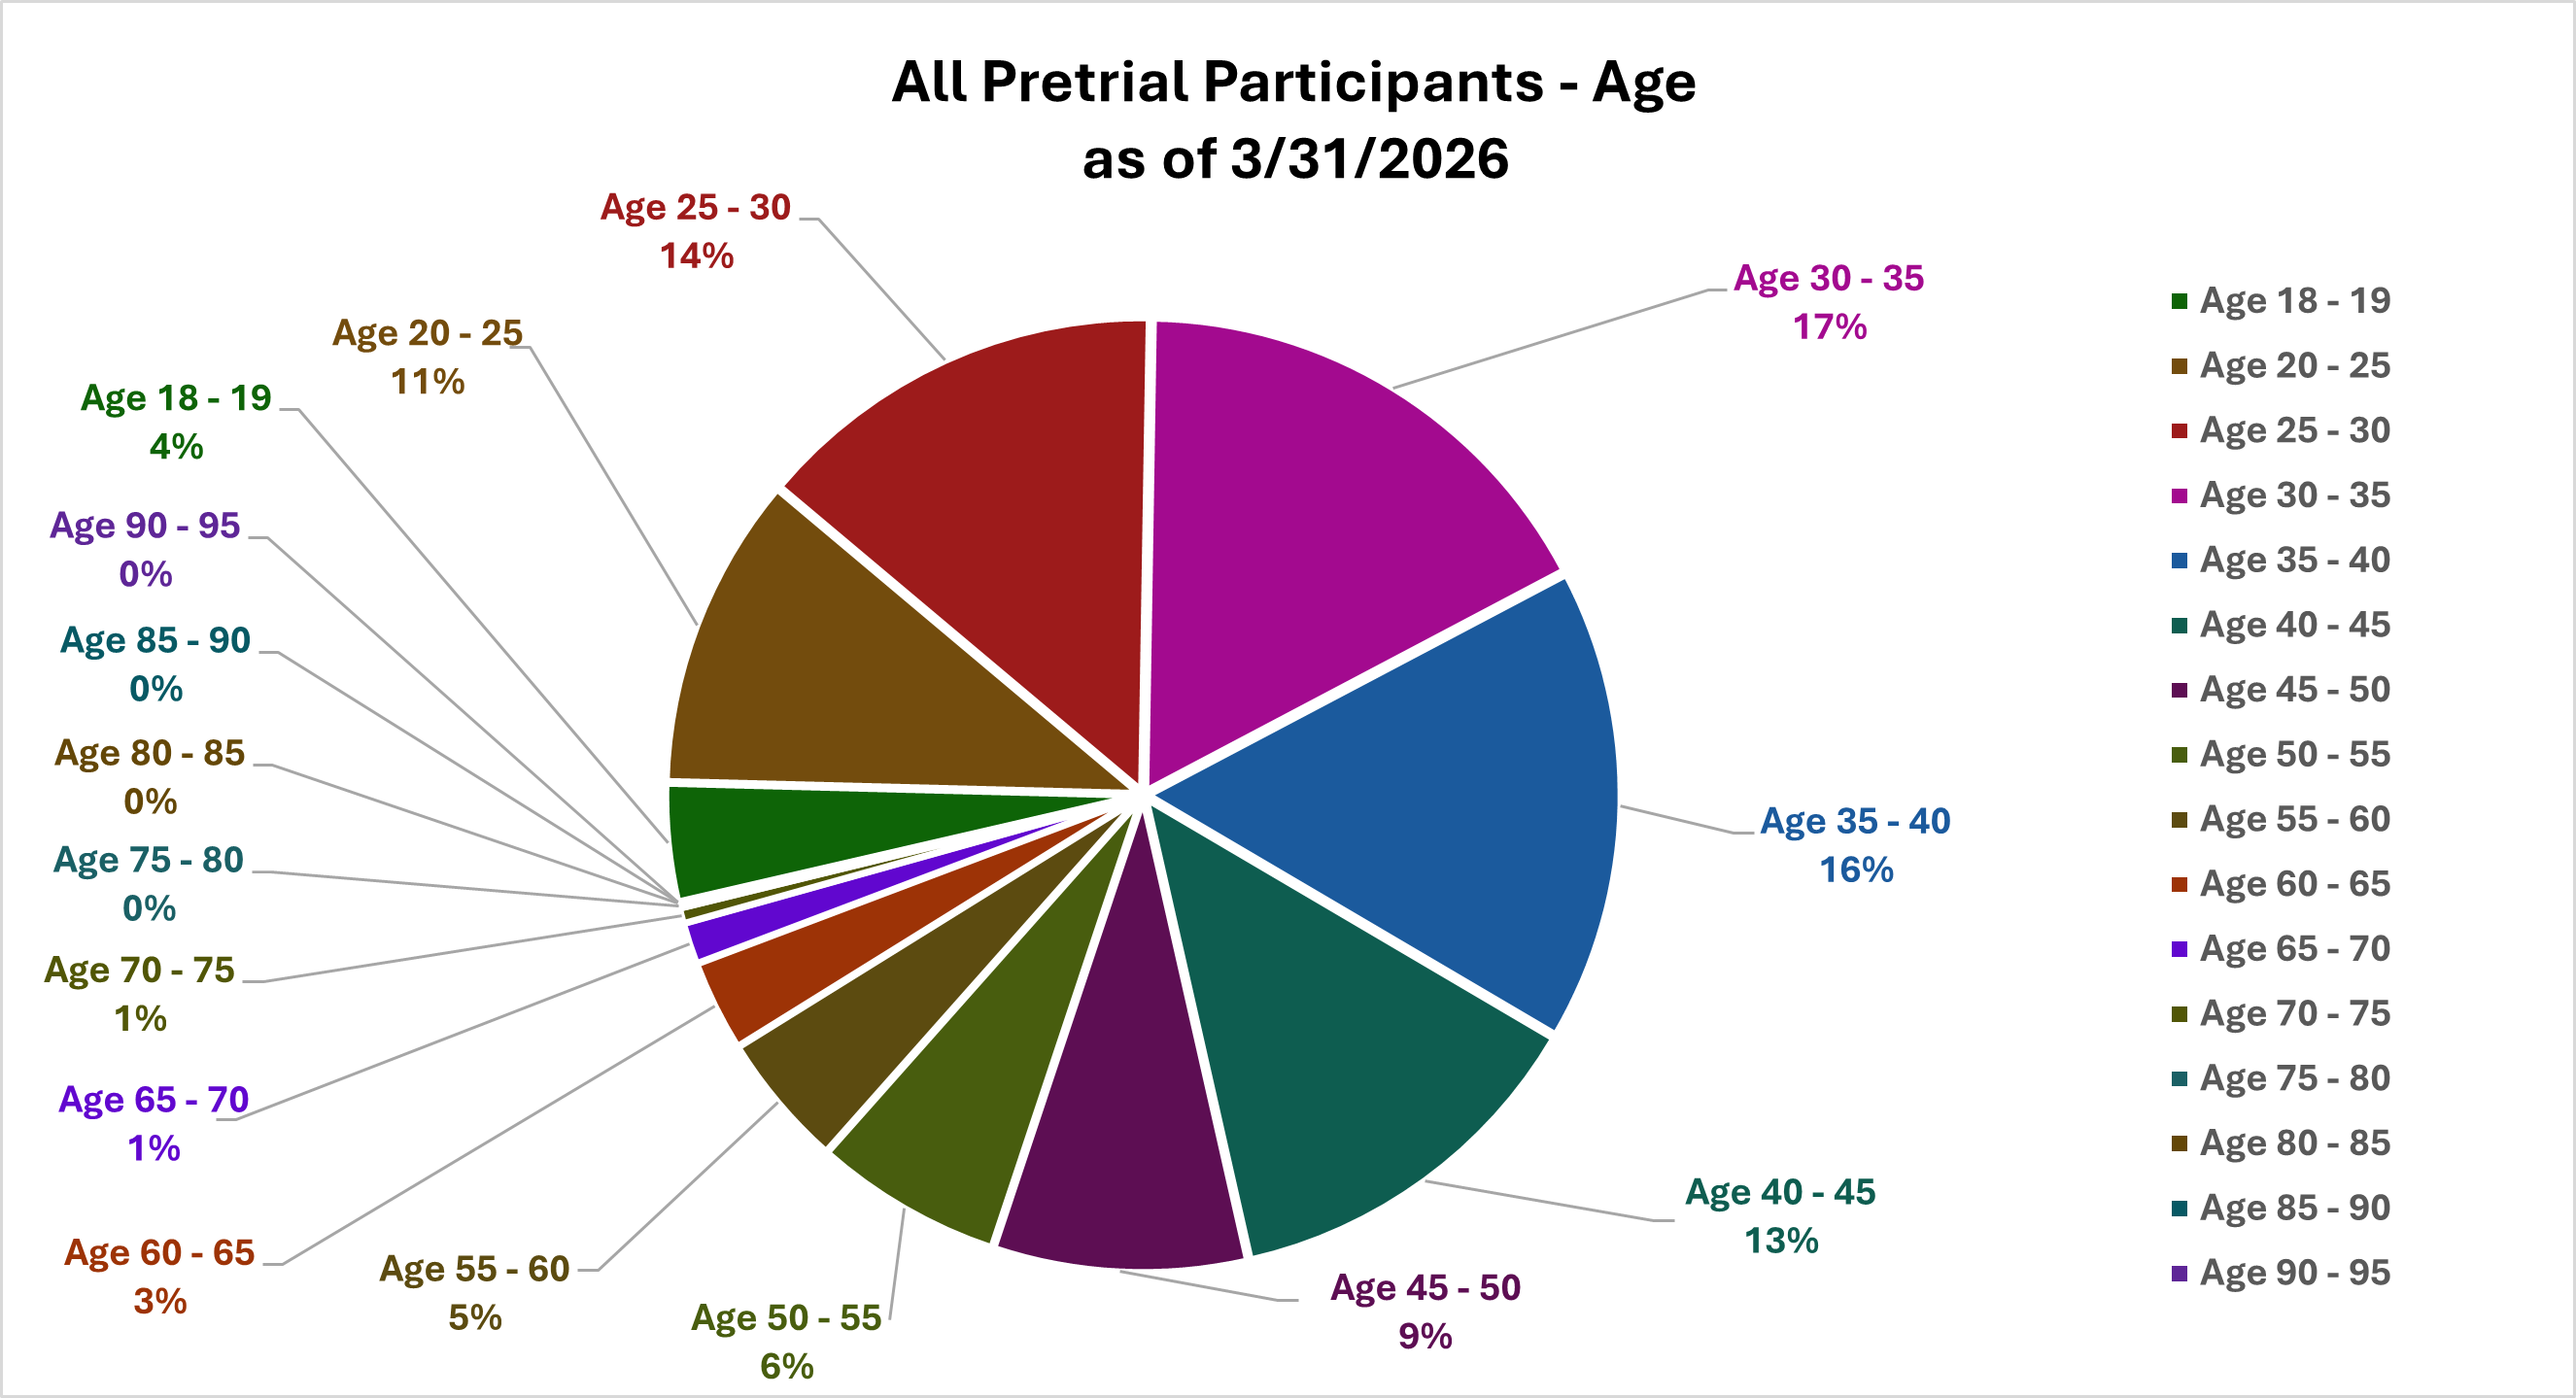
Chart Data
- Age 18 to 19: 5% (673)
- Age 20 to 25: 11% (1796)
- Age 25 to 30: 15% (2367)
- Age 30 to 35: 18% (2850)
- Age 35 to 40: 17% (2712)
- Age 40 to 45: 14% (2177)
- Age 45 to 50: 9% (1450)
- Age 50 to 55: 7% (1078)
- Age 55 to 60: 5% (771)
- Age 60 to 65: 3% (519)
- Age 65 to 70: 2% (236)
- Age 70 to 75: 1% (88)
- Age 75 to 80: 0% (28)
- Age 80 to 85: 0% (4)
- Age 85 to 90: 0% (1)
- Age 90 to 95: 0% (1)